Reverse Engineering with radare2
Jun 22
/
Vikrant Chauhan
radare2 is a free, open-source reverse engineering framework. It runs entirely from the terminal, reads Mach-O binaries directly, and ships as a set of small command-line tools rather than a single program. Other disassemblers and decompilers are good too, but I love working in radare2 for some reason.
The commands looks like hard to read at first, but it's a small, consistent set of letters you combine to spell what you want, and it gets easier the more you use it. Alongside r2 we will lean on rabin2, its companion tool for pulling headers, imports, strings, and symbols straight out of a binary. Let's get started!
The commands looks like hard to read at first, but it's a small, consistent set of letters you combine to spell what you want, and it gets easier the more you use it. Alongside r2 we will lean on rabin2, its companion tool for pulling headers, imports, strings, and symbols straight out of a binary. Let's get started!
Installing radare2
Radare2 is best installed from source to get the latest changes:
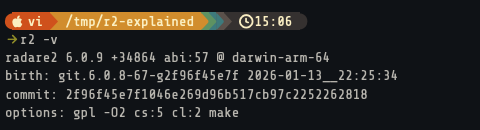
If you'd rather not compile it, prebuilt binaries for macOS, Linux, and Windows are on the releases page at https://github.com/radareorg/radare2/releases. Either way, check it works with r2 -v:
Basics of radare2
You point radare2 (r2) at a binary and it gives you a prompt for inspecting it. The work always follows the same shape. First you run analysis, usually aaa or the more thorough aaaa, which finds functions, resolves references, and names what it can. Then you poke around: list functions, disassemble them, read strings and imports, follow cross-references, and move the cursor wherever you want to look next.
A couple of conventions make the commands easier to read. They're built up one letter at a time, left to right, so p is print, pd is print-disassembly, pdf is print-disassembly-of-function. Append ? to any prefix (p?, a?) and r2 lists everything under it, which is how you discover commands without leaving the prompt. And almost everything operates at the current address, called the seek, which you move with s.
Here are the commands you'll use most:
A couple of conventions make the commands easier to read. They're built up one letter at a time, left to right, so p is print, pd is print-disassembly, pdf is print-disassembly-of-function. Append ? to any prefix (p?, a?) and r2 lists everything under it, which is how you discover commands without leaving the prompt. And almost everything operates at the current address, called the seek, which you move with s.
Here are the commands you'll use most:
| Command | What it does |
aaa / aaaa |
Analyze the binary (functions, refs, names); aaaa is more thorough |
i |
File info: format, arch, stripped, PIE |
afl |
List analyzed functions |
s <addr|name> |
Seek (move the cursor) to an address or symbol |
pdf |
Disassemble the current function |
pd <n> |
Disassemble n instructions from the seek |
px |
Hex dump at the seek |
ii |
List imports |
is |
List symbols |
iz / izz |
Strings in data sections / the whole file |
ic |
List Objective-C classes and methods |
axt |
Cross-references to the current address |
V / VV |
Visual mode / graph view |
<cmd>? |
Help for any command or prefix |
q |
Quit |
The rest of this section walks through these on a real binary.
A First Pass Through a Binary
To have something concrete to open, we'll compile a tiny program. Save this as pincheck.c:
Build it for arm64 with clang:
That gives you a Mach-O arm64 binary, the same format and architecture as an iOS app binary. Open it read-only first, so you never patch by accident:
You land at a prompt showing the current address, the entry point by default:
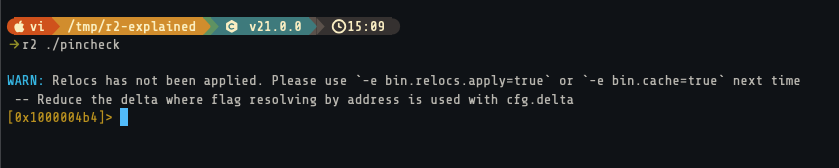
radare2 does almost no analysis when it opens a file. That's deliberate, it's fast because it's lazy. You have to tell it to analyze.
Analyze It
The command you'll type more than any other:
That's "analyze, analyze, analyze." It finds functions, resolves references, builds the cross-reference database, and names things from symbols. There's a heavier aaaa that does more (emulation-assisted analysis, more aggressive function detection) at the cost of time. On a big iOS binary aaa is usually the right call to start; reach for aaaa when aaa misses functions.
You can also analyze on open with r2 -A ./pincheck. On large binaries it's better to skip that and run analysis manually, so you control when the slow part happens.
Look Around
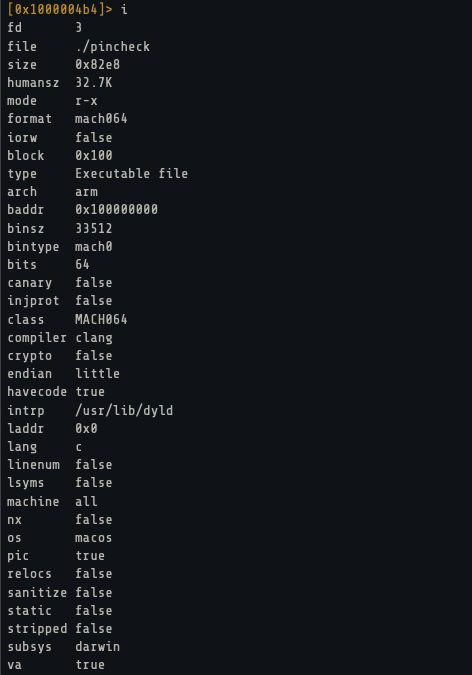
Now that it's analyzed, get the lay of the land. Start with file info:
This tells you the format (Mach-O), the architecture (arm64), whether it's stripped, whether it's PIE, and a pile of other metadata. For iOS work a few of these fields matter a lot, and we'll come back to them.
Next, list the functions radare2 found with afl ("analyze, functions, list"). You get a table of address, size, basic-block count, and name. Our two functions, main and check_pin, show up alongside the imported printf and strcmp. On a stripped binary the names would be fcn.xxxxxxxx; here the symbols survived because we didn't strip them.
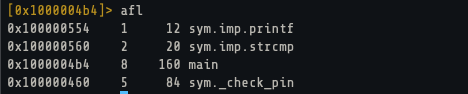
To jump to one, seek to it by name or address:
Disassemble
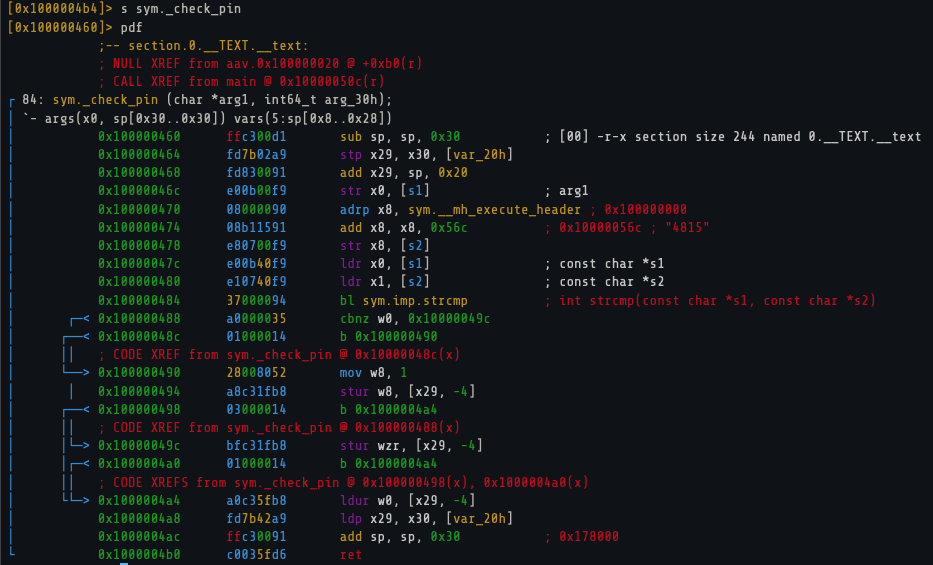
With the seek on check_pin, print its disassembly:
"Print disassembly, function." radare2 draws the basic-block boundaries, jump arrows on the left, and resolves references inline. You can read the logic straight off it: the secret "4815" gets loaded, strcmp compares it against the argument, and the result decides which branch returns 1 or 0.
If you just want the next N instructions from where you are, regardless of function boundaries, use pd:
Twenty instructions from the seek. To go the other way, pd -10 prints ten instructions backward.
Strings, Imports, Symbols
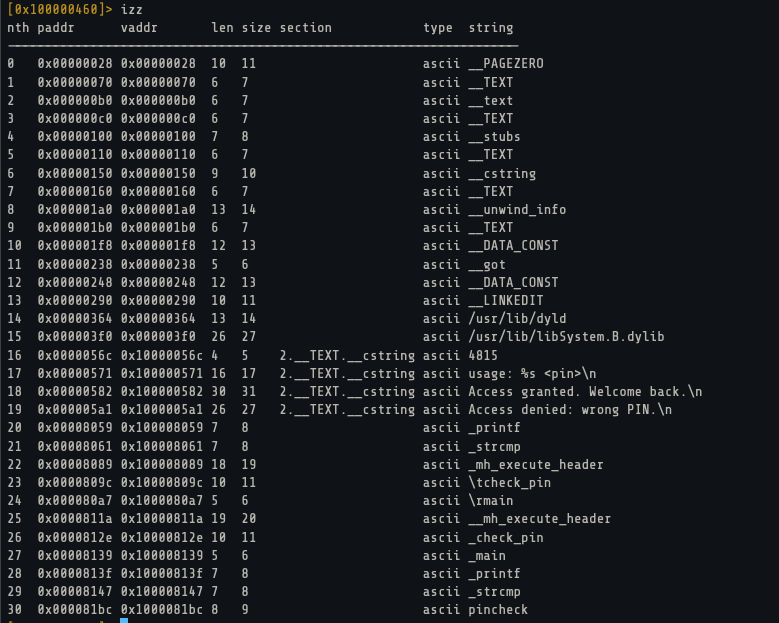
Strings are usually the first thread to pull on:
iz lists strings in the data sections, izz scans the entire binary. There's the hardcoded PIN sitting in plaintext, along with the program's messages. On a real iOS app this is where you'd find error text, URL endpoints, plist keys, and very often the literal strings an app checks for when it's looking for a jailbreak (/Applications/Cydia.app, /bin/bash, cydia://). Imports show the external functions the binary calls:
Just printf and strcmp here. On an iOS binary this list is worth reading closely. You'll see objc_msgSend (every Objective-C method call funnels through it), dlopen, dlsym, fork, stat, getenv, the C functions an app reaches for when it's doing something low-level. An app that imports fork and stat on an iPhone is almost always sniffing for a jailbreak, processes don't fork on stock iOS. For symbols and sections use:
rabin2
Everything we just did, the headers, imports, strings, symbols, has a standalone twin called rabin2. It ships with radare2 and reads all the same Mach-O metadata, except from your shell, without launching an interactive session or running any analysis. When you just want to glance at a binary, or you're scripting across a whole pile of them, rabin2 is faster than firing up r2.
The flags mirror the in-program commands, just with a dash. Try them on pincheck:
rabin2 -I is the one you'll run most on iOS. Among its output is a crypto field, a one-liner for checking whether an App Store binary is still FairPlay-encrypted before you spend time on it:
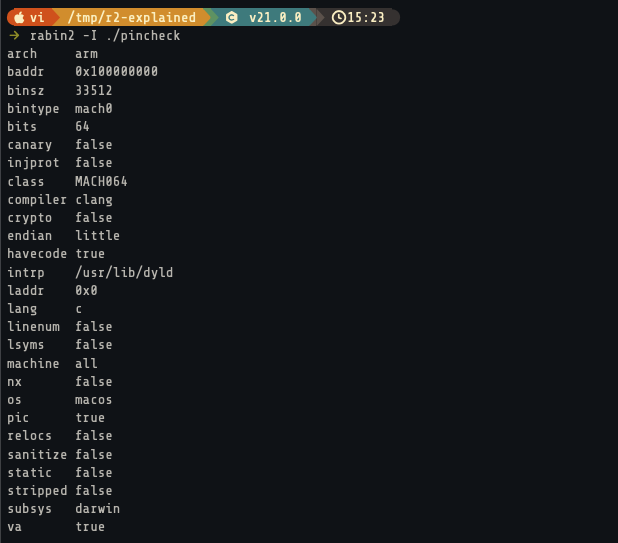
On an Objective-C app, rabin2 -c dumps the entire class and method layout in one shot, which you can pipe into grep when you're looking for a class by name (rabin2 -c ./MobileTimer | grep -i timer). Our C binary has no classes, so it's empty here, but it's one of the first things you'll run on a real app like the Clock binary we get to in the next section.
There's also rabin2 -x to extract a single architecture slice out of a fat binary, and rabin2 -O for a handful of Mach-O patching operations. Use rabin2 when you don't need the interactive session, just the metadata.
Cross-References
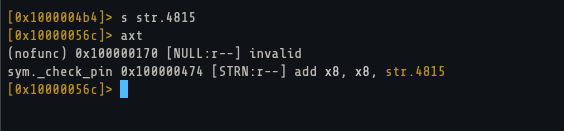
You found an interesting string or function. The next question is usually who uses this? That's a cross-reference, and it's one of the core ideas in static reversing. radare2 flagged the PIN string as str.4815, so seek to it and run axt:
"Analyze, xrefs, to." It lists every place that references the current address. The only thing touching the PIN string is check_pin, at the instruction that loads it. That's how you walk backward from data to the code that uses it, and on a real app it's how you go from "this string shows a jailbroken device detected alert" to "here's the function that makes the decision."
axf does the opposite, references from the current spot.
Flags: Naming Things
As you figure out what things are, name them so future-you isn't lost. radare2 calls these flags, named bookmarks on addresses:
Now s my.pin_string takes you straight there, and the name shows up in disassembly wherever the address is referenced. You can also rename the function you're sitting in with afn, and drop a comment with CC:
Reversing is mostly an exercise in turning a wall of hex into named, commented landmarks, and these are how you do it.
Visual Mode
Everything so far has been the command prompt, but radare2 has a full-screen visual mode that a lot of people live in. Seek to check_pin and press V:
Now you're in a live disassembly view. Arrow keys or j/k to scroll, Enter to follow a jump or call, u to go back (undo seek). Press p and P to rotate between view modes, hex, disassembly, debug. The view you'll want most is the graph view. Press V again from inside (or VV from the prompt) and the function becomes a control-flow graph, boxes and arrows. In graph mode, Space toggles back to linear. Press q to back out of any of these.
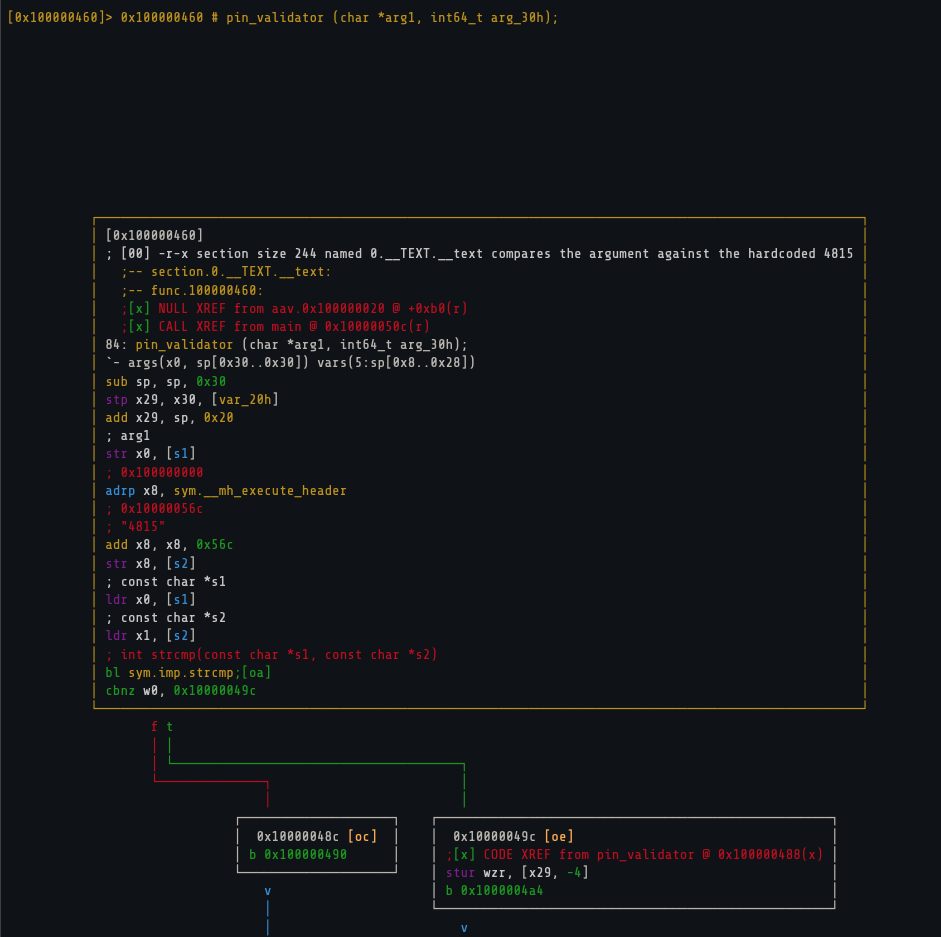
There's also a panels mode (v, lowercase) that splits the screen into disassembly, registers, stack, and more, but for static work the graph view is the one you'll use most. When a function's control flow branches around a lot of checks, the graph is easier to follow than the linear listing.
That's the foundation. Open, aaa, list functions, disassemble, chase strings and imports, follow cross-references, name what you learn. Everything else builds on this loop.
Reverse Engineering iOS Binaries
The walkthrough above used a binary we compiled ourselves. A real iOS app adds a few hurdles: encryption, fat binaries, and the Objective-C indirection that makes method calls hard to follow. We'll work through them on an app that's already on every iPhone, the Clock app, whose binary is named MobileTimer.
First, get the binary off a jailbroken device. Apple's internal names rarely match the home-screen name, so find it by the real one over SSH:
Copy the MobileTimer file out of its .app to your computer with scp and open it. The bundle UUID will differ on your device.
Is It Encrypted?
Every app distributed through the App Store is encrypted with Apple's FairPlay DRM. The __TEXT segment, the part with the code you want to read, is scrambled on disk; iOS decrypts it in memory at launch. So the first thing to check on any app binary is whether it's encrypted:
crypto false means __TEXT is real code you can read directly. The Clock app, like every system app and anything you've sideloaded yourself, isn't FairPlay-encrypted, so we can analyze it as-is. An App Store app would show crypto true (or cryptid 1 in its LC_ENCRYPTION_INFO_64 load command), and disassembling it gives you nonsense because you're reading ciphertext. People burn an hour confused about why a binary looks like garbage before they check this. Run iI first, every time.

Fat Binaries and Architecture
iOS binaries are sometimes fat (also called universal), one file containing slices for multiple architectures. MobileTimer is a single arm64 slice, but you'll still hit multi-slice binaries, especially older ones with arm64 and arm64e. When there's more than one, radare2 needs to know which you mean. List the slices:
If there's more than one, pick the slice when you open the file:
On modern devices you want the arm64e slice if it's there, since that's what runs on recent hardware.
radare2's grep
iOS binaries are large and command output runs long, so you'll filter constantly. ~ is a grep built into the command parser. Pipe any command into it:
You can do columns and counts too. afl~Timer:0 gets the first column, ic~? counts the matches. On a binary with thousands of functions, ~ is how you narrow the list down to what you're after.
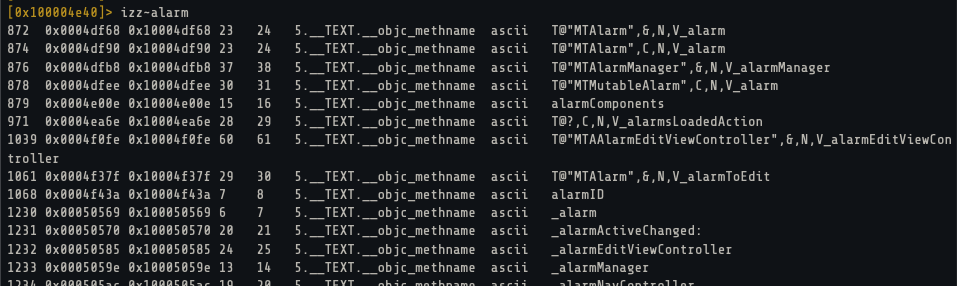
Objective-C: Reading the Metadata
Run iI~lang on MobileTimer and you'll see objc with blocks. Objective-C is a dynamic runtime, and to make that work the compiler leaves a lot of metadata in the binary: every class, every method name, every selector, every property, all in special __objc_* sections in plain text. iI~stripped reports true for the Clock app, but a "stripped" Objective-C binary isn't really stripped, the method names are still right there in the metadata.
radare2 parses all of it. List the classes:
You get all 58 classes, each with its MTA prefix (MobileTimer App) and superclass, names like MTATimerViewController :: UIViewController. Pick one and dump its methods:
Each method comes with its selector and the address it lives at, basically a header file reconstructed from metadata. That wall of fcn.xxxxxxxx functions now has real names like MTATimerViewController.reloadState:. After aaa, radare2 folds these names into the disassembly, so pdf shows you Objective-C selectors instead of raw addresses.
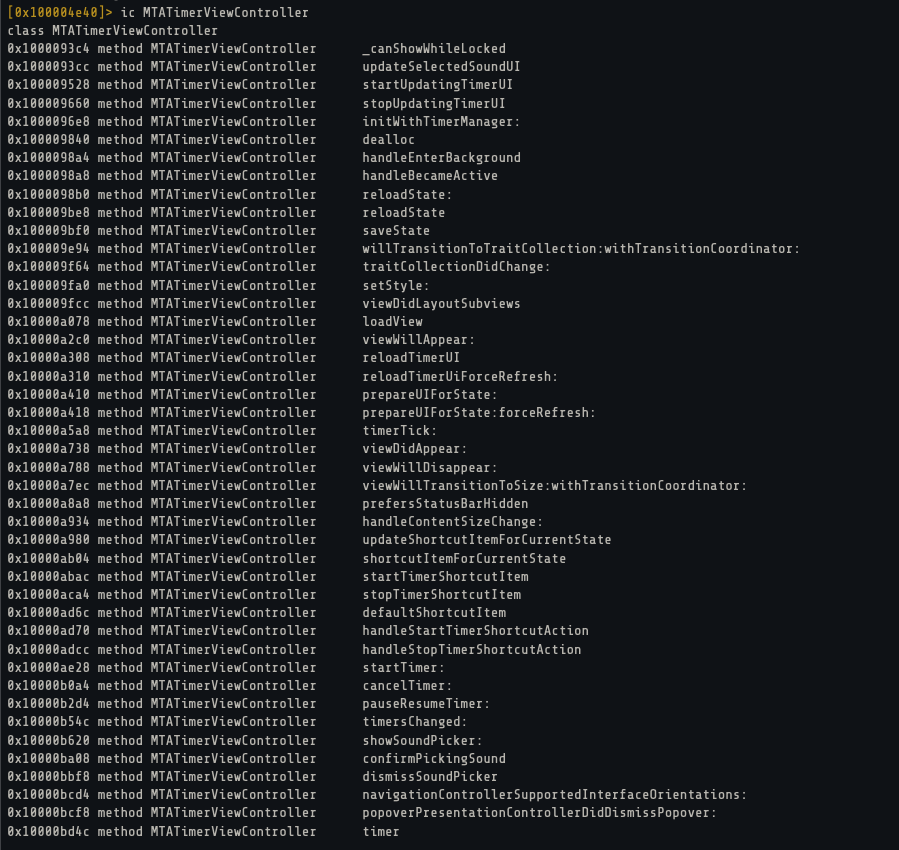
This metadata is why Objective-C apps are easier to read statically than you might expect. The app tells you what its methods are called; the work is figuring out which ones matter and reading them.
Following objc_msgSend
There's a catch with Objective-C, and it trips everyone up. Method calls don't compile to direct branches. [self reloadState:flag] becomes a call to objc_msgSend, with the object in x0 and the selector (the method name, as a string pointer) in x1. So in the disassembly you don't see bl MTATimerViewController.reloadState:. You see something closer to:
Every method call looks the same at the branch, a jump to objc_msgSend, and which method actually runs is decided by whatever's in x1 at that moment. (On recent arm64e binaries like the Clock app, the call usually routes through a small __objc_stubs thunk rather than a bare objc_msgSend, but the idea is identical: the selector picks the method.)
The useful consequence is that selectors are plain strings, and they sit in the __objc_methname section in clear text. So you can search for a method name directly:
The two hits, reloadState and reloadState:, sit in __TEXT.__objc_methname, and that reloadState: string is the exact value a call site loads into x1. To find where a method is called, you don't axt the method's address (nobody branches to it directly), you axt the selector string instead and follow its references back toward the call sites. The rule to remember: in Objective-C, follow the selector, not the function.

Swift: The Harder Sibling
The Clock app is pure Objective-C, but most third-party apps you'll meet are at least partly Swift, and Swift is less generous. There's no big plaintext method table. What you do get are mangled symbols, names encoded with type information in a compact scheme that looks like line noise:
radare2 can demangle these. It often does it automatically during analysis, but you can force it:
and you'll see the demangled form, something readable like MyApp.LoginViewController.validatePIN(String) -> (). If a name comes through still mangled, the iD command (or the idpd/demangle helpers depending on your version) will decode an individual symbol.
Swift that bridges to Objective-C (anything marked @objc, which includes a lot of UIKit-facing code) still shows up in the Objective-C metadata, so ic catches it. Pure Swift internals are harder, you're reading demangled names and disassembly without the runtime metadata crutch. Objective-C apps are an open book and Swift apps make you work for it. Most real apps are a mix, and the security-relevant logic is often in the Objective-C-bridged surface anyway.
Swift that bridges to Objective-C (anything marked @objc, which includes a lot of UIKit-facing code) still shows up in the Objective-C metadata, so ic catches it. Pure Swift internals are harder, you're reading demangled names and disassembly without the runtime metadata crutch. Objective-C apps are an open book and Swift apps make you work for it. Most real apps are a mix, and the security-relevant logic is often in the Objective-C-bridged surface anyway.
Going beyond basics
Everything so far, analysis, disassembly, strings, cross-references, is enough to find your way around a binary, and a realistic task just chains those steps. Say an app pops a "this device is not secure" alert on your jailbroken phone and you want to disable that check. You search the strings for the alert text (izz~secure), axt the string to find the function that uses it, read that function as a graph, and confirm what you're seeing from the paths and imports it touches (izz~Cydia, ii~fork). String, then cross-reference, then function, then confirm. Once that loop is comfortable, "how does this app detect X" becomes mechanical.
From here radare2 goes deeper than the basics. Patching and r2frida are the two you'll most likely reach for next, followed by a handful of everyday commands and a couple of heavier tools worth knowing by name.
Patching the Binary
Reading is one thing; changing behaviour is another, and it's often the goal, force a check to pass, flip a flag, neuter a jailbreak test. Open the file in write mode (-w) and rewrite instructions with wa (write assembly). Here's check_pin patched to always return 1, so any PIN is accepted:
wao nop neutralizes a single instruction, and wx writes raw bytes when you need them. The change is written straight to the file.
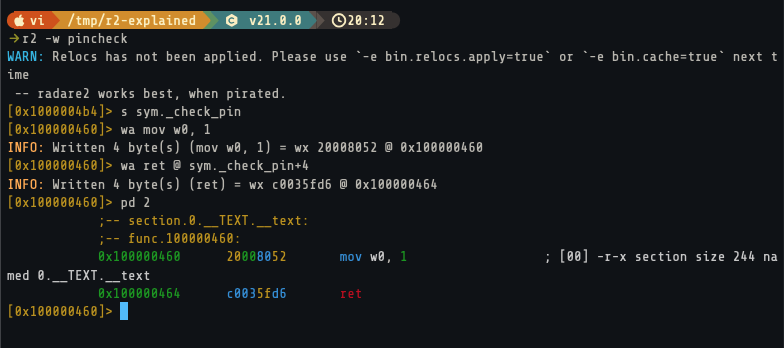
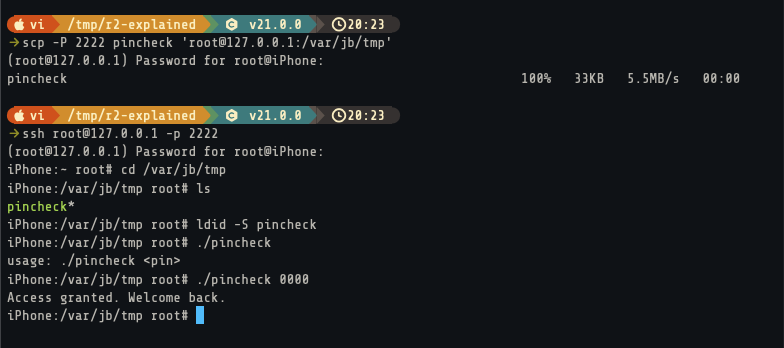
There's a catch: editing the binary invalidates its code signature, and iOS refuses to launch an unsigned binary. Copy the patched file to the device and re-sign it with ldid:
Wrong PIN and still access granted, that's the patch working. (A patched binary that silently refuses to launch is almost always a signature problem; re-signing is the fix.)
Dynamic Analysis with r2frida
Static analysis tells you what an app can do; sometimes you need to watch it run, with real arguments, real return values, real decrypted memory. r2frida bridges radare2 into a live process through Frida. Install it once, then point radare2 at a process with a frida://[action]/[link]/[device]/[target] URL. To spawn the Clock app over USB by its bundle id:
Use frida://attach/usb//Clock instead if the app is already running, and frida://apps/usb lists everything Frida can see. Now the "binary" is the live process, already decrypted in memory. r2frida adds its own commands under a : prefix, :i for process info, :dm for memory maps, :dt <addr> to trace calls, and you can hook functions and rewrite return values on the fly. The usual flow is to find the function statically first, then attach here to confirm what it does with real data.

When you outgrow the basics, three more tools are worth knowing by name. ESIL is radare2's emulator: it runs a function in a VM (aei, aes, aer) so you can recover a value that's only computed at runtime, like a decrypted string, without launching the binary. r2pipe scripts radare2 from Python or JavaScript and returns JSON (aflj, icj), which is how you automate the same query across many binaries. And zignatures (zg to generate, z/ to apply) fingerprint known library functions so statically linked code like OpenSSL gets named automatically instead of showing up as anonymous fcn.xxxxxxxx. Each has its own ? help (ae?, z?) when you're ready to dig in.
Wrapping up
If you want to practice on real targets, our free labs are built for exactly this kind of poking around. Pictator and Broke Lesnor have real memory bugs worth dissecting statically before you ever attach a debugger.
If you want to go further with live debugging on iOS, our Basics of LLDB article picks up there. Once you are ready, be sure to take our iOS Userland Fuzzing and Exploitation course which goes in depths of fuzzing and exploitation for iOS.
If you want to go further with live debugging on iOS, our Basics of LLDB article picks up there. Once you are ready, be sure to take our iOS Userland Fuzzing and Exploitation course which goes in depths of fuzzing and exploitation for iOS.

Copyright © 2024
Company
Mobile Hacking Lab B.V.
Registration:
97390453
VAT:
NL868032281B01
Registration:
97390453
VAT:
NL868032281B01